Common seeding methods in tournaments
Seeding is a crucial part of tournaments. It is most notably used to ensure that strong participants only get to face each other towards the end of a tournament. Thus, securing a higher seed will allow a player/team to avoid facing stronger opponents in the early stages.
Commonly, a tournament will make use of Qualifiers to determine seedings. During this stage, all players/teams set scores on a fixed set of maps. The resulting scores are then used in combination with formulas to determine the specific seeds. This page details some commonly used seeding methods found in osu! tournaments.
If you believe a commonly used seeding method is missing from this page, please contact a member of the Tournament Committee.
Official support
If you are seeking official support for your tournament and you are using the formulas or methods as described on this page exactly as they are written, you may refer to the name as described in the seeding methods section instead of specifying the exact formula. However, should there be any difference or change from the methods described here, you will be required to provide the full formula in your tournament's ruleset. If you are using a different seeding method not found on this page, make sure to specify the exact formulas and/or method used.
As always, a third party should be able to get the same results without needing additional information.
Mini-glossary
The explanations below frequently use the following terms:
- A team is a single entity participating in the tournament. For example, the 6–8 players from each country in OWC are considered one team, while each player in the Lazer Grand Arena is considered their own team.
- A score is a numerical value used for determining a team's performance on a given map. For example, in a 3v3 team tournament, a score typically refers to the sum of the three team members' scores, rather than those three numbers separately. Some tournaments may allow teams multiple runs through a Qualifier mappool. In those cases, the team's score is often either the highest or the average of those runs.
- A team's seed is a number indicating their overall ranking among all teams. Typically, after one of the seeding methods below is used, the top N teams (that is, the teams seeded 1, 2, ..., N) are placed into an elimination bracket or other competition format, with their locations being determined by their seeds.
- Normalisation is the process of dividing a team's score by any mod multipliers on the map. Typically, this is done to avoid artificial inflation of scores on modded maps.
Seeding methods
Each subsection below explains a different seeding method commonly found in osu! tournaments, both in words and with a mathematical formula. In all formulas, m refers to the number of maps in the Qualifier mappool.
Average score
This seeding method averages each team's scores on all maps. Typically, scores are first normalised. Teams are then seeded in order of this average, with the highest average receiving seed 1.
The average score for a team is given by

If any of the maps are played with Free Mod, it must be explicitly specified whether each individual player's score on the map is normalised by the mods they use — effectively nullifying multipliers of any additional mods taken — or if there is an overall normalisation, where all scores are divided only by the globally required mod multipliers.
Sum of placements
This seeding method ranks all scores on each map played from highest to lowest, with the highest-scoring team receiving a rank of 1, the next receiving 2, and so on. A team's overall seeding is then determined by the sum of these numbers (called placements); the lowest sum receives seed 1, the next lowest receives seed 2, and so on.
The sum of placements for a team is given by

Instead of a sum, the placements may also be averaged, which yields the same overall seeding. This is commonly referred to as average placement. Note that if two teams both receive the highest score on a map, their map placements are both 1 (rather than both being 2); more explicitly, a team's map placement on a map is the number of teams who score higher than them plus one.
Percent max
This seeding method assigns each team some number of points between 0 and 1 on each map by dividing their score by the highest score achieved. Seeding is then determined by the sum of these map points, with the highest sum receiving seed 1.
The percent max sum for a team is given by

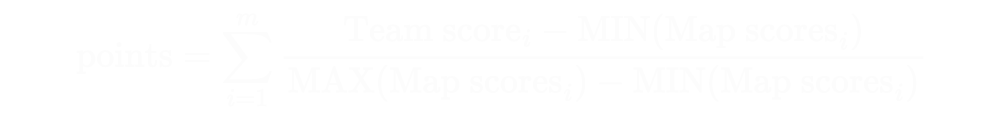
Percent difference
This seeding method is almost identical to percent max, except that it assigns the lowest score on each map 0, the highest score on each map 1, and all others linearly in between.
The percent difference sum for a team is given by
Z-sum
This seeding method first computes the average and standard deviation of team scores on each map. Each team then receives a "Z-score" for each map, which is the number of standard deviations above or below the mean that they scored. (0 is an average Z-score, and Z-scores are typically between -3 and 3.) Seeding is then determined by the sum of these Z-scores, with the highest sum receiving seed 1.
Note that tournaments in the past have often used the term "Z-sum" for a distinctly different method that is instead called "Z-percentile" in this article.1 The Z-sum seeding method should result in roughly half the teams having a negative total sum of Z-scores and half having a positive sum. The total sum over all teams should be exactly 0.
The Z-sum for a team is given by

Typically the sample standard deviation is used, rather than the population standard deviation.
Z-percentile
This seeding method is almost identical to Z-sum, except that instead of assigning teams a Z-score, it assigns teams the corresponding percentile under the standard normal distribution). In other words, Z-percentile estimates the percentage of teams beaten on each map by fitting scores to a bell curve, and each team will receive a value between 0 and 1 on each map played. Seeding is then determined by the sum of these values, with the highest sum receiving seed 1.
The Z-percentile sum for a team is given by
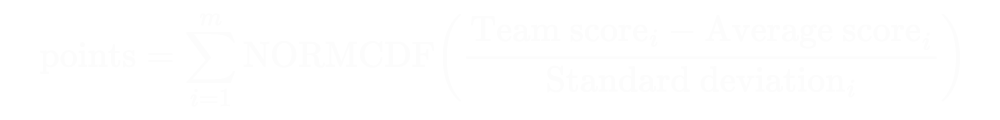
Here, NORMCDF is the cumulative distribution function for the standard normal distribution (also sometimes called NORMSDIST in software).
Zipf's law
Much like the sum of placements method, this seeding method ranks all scores on each map played, but it then gives the team points according to a version of the Zipf–Mandelbrot law. This yields a particularly high number of points for the top scorers on each map (largest gap between the first and second-highest score), and seeding is then determined by the sum of all points received (with the highest sum receiving seed 1).
The usual formula used for assigning points is given by

Note that this seeding method may still make sense if 1.4 * m is replaced by some other nonnegative real number, or if the numerator is replaced by another positive real number, or if the denominator is raised to some positive real number. But these changes must be specified explicitly if used.
Additional considerations
Breaking ties
All of the methods above may result in ties between teams. By default, these ties are usually broken by average normalised score (so if multiple teams would otherwise receive the same seeding rank, the team with the highest average normalised score would be seeded above the others). It is extremely rare to also have a tie after this point, but one option would be to assign the higher seeding to the higher-ranked player (or in the case of teams, the highest-ranked player per team) at the time when registrations close.
Other options for breaking ties may also be sensible (such as the number of top-N placements on maps), but they should be specified in documentation if used.
Rounding
Unless otherwise specified, it is important to avoid intermediate rounding (unless for display purposes only). For example, if the percent max seeding method is being used, each of the map points should not be rounded to the nearest hundredth before being added together, since this rounding may alter teams' relative ranking. In seeding methods like Z-sum or Z-percentile, it is common for different teams' total scores to look the same when rounded but actually be slightly different; in those cases, the true numbers, rather than the rounded ones, should be used.
Weighting maps
Many of the methods above assign each team a number of points on each map and then add or average those points together to determine final seeding. It may also make sense to perform a weighted average so that some maps contribute more than others to final standings. For example, osu!mania tournaments may assign niche skill sets or physically demanding maps a lower weight than fundamental skill sets or accuracy-based challenges.
More precisely, a positive number for each map, called the map weight, should be specified. The final number used for seeding is then

where map points is the quantity that the seeding method assigns to each map (e.g. map placement for the sum of placements method). Note that having all map weights be equal to 1 or 1/(number of maps) would just be equivalent to summing or averaging the map points together.
Differences between methods
There are many factors that go into choosing a seeding method for a tournament. First of all, the following principles are important to keep in mind:
- Lack of Qualifiers: All of the seeding methods above assume that teams all play through the same Qualifier mappool. If Qualifiers are not played, then it may make sense instead to seed by rank or BWS. (For example, a 2v2 tournament with team size 4 may seed teams by the sum of their two best BWS ranks, with the smallest sum being seeded 1st.)
- Note that some tournaments may begin head-to-head competition by placing teams into a Group Stage or Swiss-system tournament instead of a standard elimination bracket. However, these other systems still require specification on how the teams are placed into matchups, meaning a method of seeding is still likely required (either one of the ones mentioned in this page, or random drawings).
- Scoring system: Most of the seeding methods above are typically used when tournaments are played with the ScoreV2 scoring system. Thus, extra care should be taken when seeding tournaments that use ScoreV1, accuracy, or other methods of scoring. For example, a map played with ScoreV1 may have high outliers from well-performing teams, so it may be less appropriate to seed by Z-percentile or percent max.
- Transparency and familiarity: More complicated seeding methods, or new formulas that are not widely used in tournaments, may be more difficult for players and staff to understand or double-check. It may be advantageous to choose a seeding method that can be quickly sanity-checked without needing heavy calculation.
Comparing the most commonly used methods
Below is a list of Qualifier seeding methods used in the official osu! World Cups (which are team tournaments). Note that older tournaments often instead directly began with a group stage, choosing the qualifying teams by the osu! website's country rank.
| osu! | osu!taiko | osu!catch | osu!mania 4K | osu!mania 7K | |
|---|---|---|---|---|---|
| 2019 | Average placement | ||||
| 2020 | Average placement | ||||
| 2021 | Percent max | Weighted average placement (0.1–0.1625) | |||
| 2022 | Percent max | Sum of placements | Percent max | Weighted average placement (0.1–0.15) | Weighted average placement (0.1 - 0.1675) |
| 2023 | Percent max | Sum of placements | Percent max | Weighted average placement (0.1–0.145) | Average placement |
| 2024 | Percent max | Sum of placements | Percent max | Weighted average placement (0.1–0.145) | Sum of placements |
It is particularly common for tournaments to seed by sum of placements, percent max, or Z-percentile when assessing overall consistent performance, or to use Zipf's law when promoting specialists (such as in some 1v1 tournaments). Below is a table showing some sample scores that 8 teams could receive on a map, along with the points that they would be assigned for the map under three common methods (rounded to the nearest hundredth):
| Team | #1 | #2 | #3 | #4 | #5 | #6 | #7 | #8 |
|---|---|---|---|---|---|---|---|---|
| Score | 950,000 | 800,000 | 750,000 | 750,000 | 650,000 | 500,000 | 400,000 | 250,000 |
| Placement | 1 | 2 | 3 | 3 | 5 | 6 | 7 | 8 |
| Percent max | 1.00 | 0.84 | 0.79 | 0.79 | 0.68 | 0.53 | 0.42 | 0.26 |
| Z-percentile | 0.92 | 0.77 | 0.70 | 0.70 | 0.53 | 0.29 | 0.16 | 0.05 |
To contrast these methods, notice the following:
- Score differences do not directly factor into the placement except for exact ties, but they do significantly impact points under percent max and Z-percentile seeding.
- Teams 1 and 2, teams 5 and 6, and teams 7 and 8 each had a score difference of 150,000 points. This difference counts equally in all cases for percent max (about 0.16 points) but makes a bigger difference for teams 5 and 6 in Z-percentile (about 0.25 points compared to 0.15 or 0.11 for the other pairs) because their scores are closer to the mean.
- When scores are more clustered near the mean and more spread out for outliers – more precisely, when the distribution of scores is close to a bell curve – Z-percentile will favour teams similarly to sum of placements, other than the fact that very close scores will receive similar points (e.g. teams 2 through 4 above). However, if scores are more uniformly distributed, Z-percentile instead favours teams more similarly to percent max.
- If the highest score of 950,000 were instead much higher (e.g. 1,200,000), seeding by placement would remain the same, while seeding under percent max would heavily deflate all other teams, and seeding under Z-percentile would be altered slightly (most notably in shifting the average and thus the range of scores in which improvements are most important).
Finally, a side-by-side comparison of all seeding methods on this page using the osu! World Cup 2024 Qualifier data can be found in this spreadsheet.
Further analysis
Here are some other features and comparisons of seeding methods to keep in mind, especially for tournaments using methods not listed on this page.
- Some seeding methods are not very sensitive overall to individual teams' scores, while others may be changed more dramatically.
- For example, sum of placements yields the same placements no matter how large the differences between team scores are, but a particularly high or low score in percent difference may cause all other
map pointsto be unusually close together. This is particularly important for modes like osu!taiko or osu!mania where scores are typically very close to the maximum possible; historically, some tournaments such as SOFT have instead used a "piecewise-linear" percent difference method by grouping scores by quartile. - For another kind of example, the Z-sum and Z-percentile seeding methods have the feature that very close scores will receive very close point values for seeding (i.e. if there is a cluster of many nearby scores, the highest and lowest scores of those clusters will be considered similarly in seeding), which is behaviour that does not occur for the sum of placements method.
- Some seeding methods benefit specialists, while others benefit consistent performances. For example, Zipf's law will give a large boost in seeding to teams with the highest or near-highest rank on a map compared to sum of placements. Similarly, because of the shape of the normal distribution, Z-sum will give a large boost for extremely high scores (and a large reduction for extremely low scores) compared to Z-percentile. Z-percentile therefore tends to favour all-rounders over specialists compared to Z-sum.
- Some seeding methods may cause certain maps to contribute more to seeding differences than others.
- In particular, weighted seeding methods are designed to allow some maps to factor more into overall seeding than others — this allows for balancing of importance across different skill sets without needing to include extra maps of the same type in a mappool.
- For a less direct example, seeding by average score may cause relative performance on easier maps to affect seeding more than relative performance on harder maps (if it is easier to increase score by a fixed amount on the easier map than the harder one). Along the same lines, one particularly high team score on a map may mean that seeding by percent max or percent difference will give that one team a large boost while distinguishing the other teams on the map less.
Notes
The misconception between Z-sum and Z-percentile originates from taking each map score's Z-percentile and then summing all of a team's Z-percentiles. While this is a sum, it is a sum of Z-percentiles rather than Z-scores, making the two methods distinct. ↑